V-Insights
The V-Insights section provides a detailed view of all analytics created within a tenant. This page helps admins and users manage, monitor, and review analytics for different use cases.
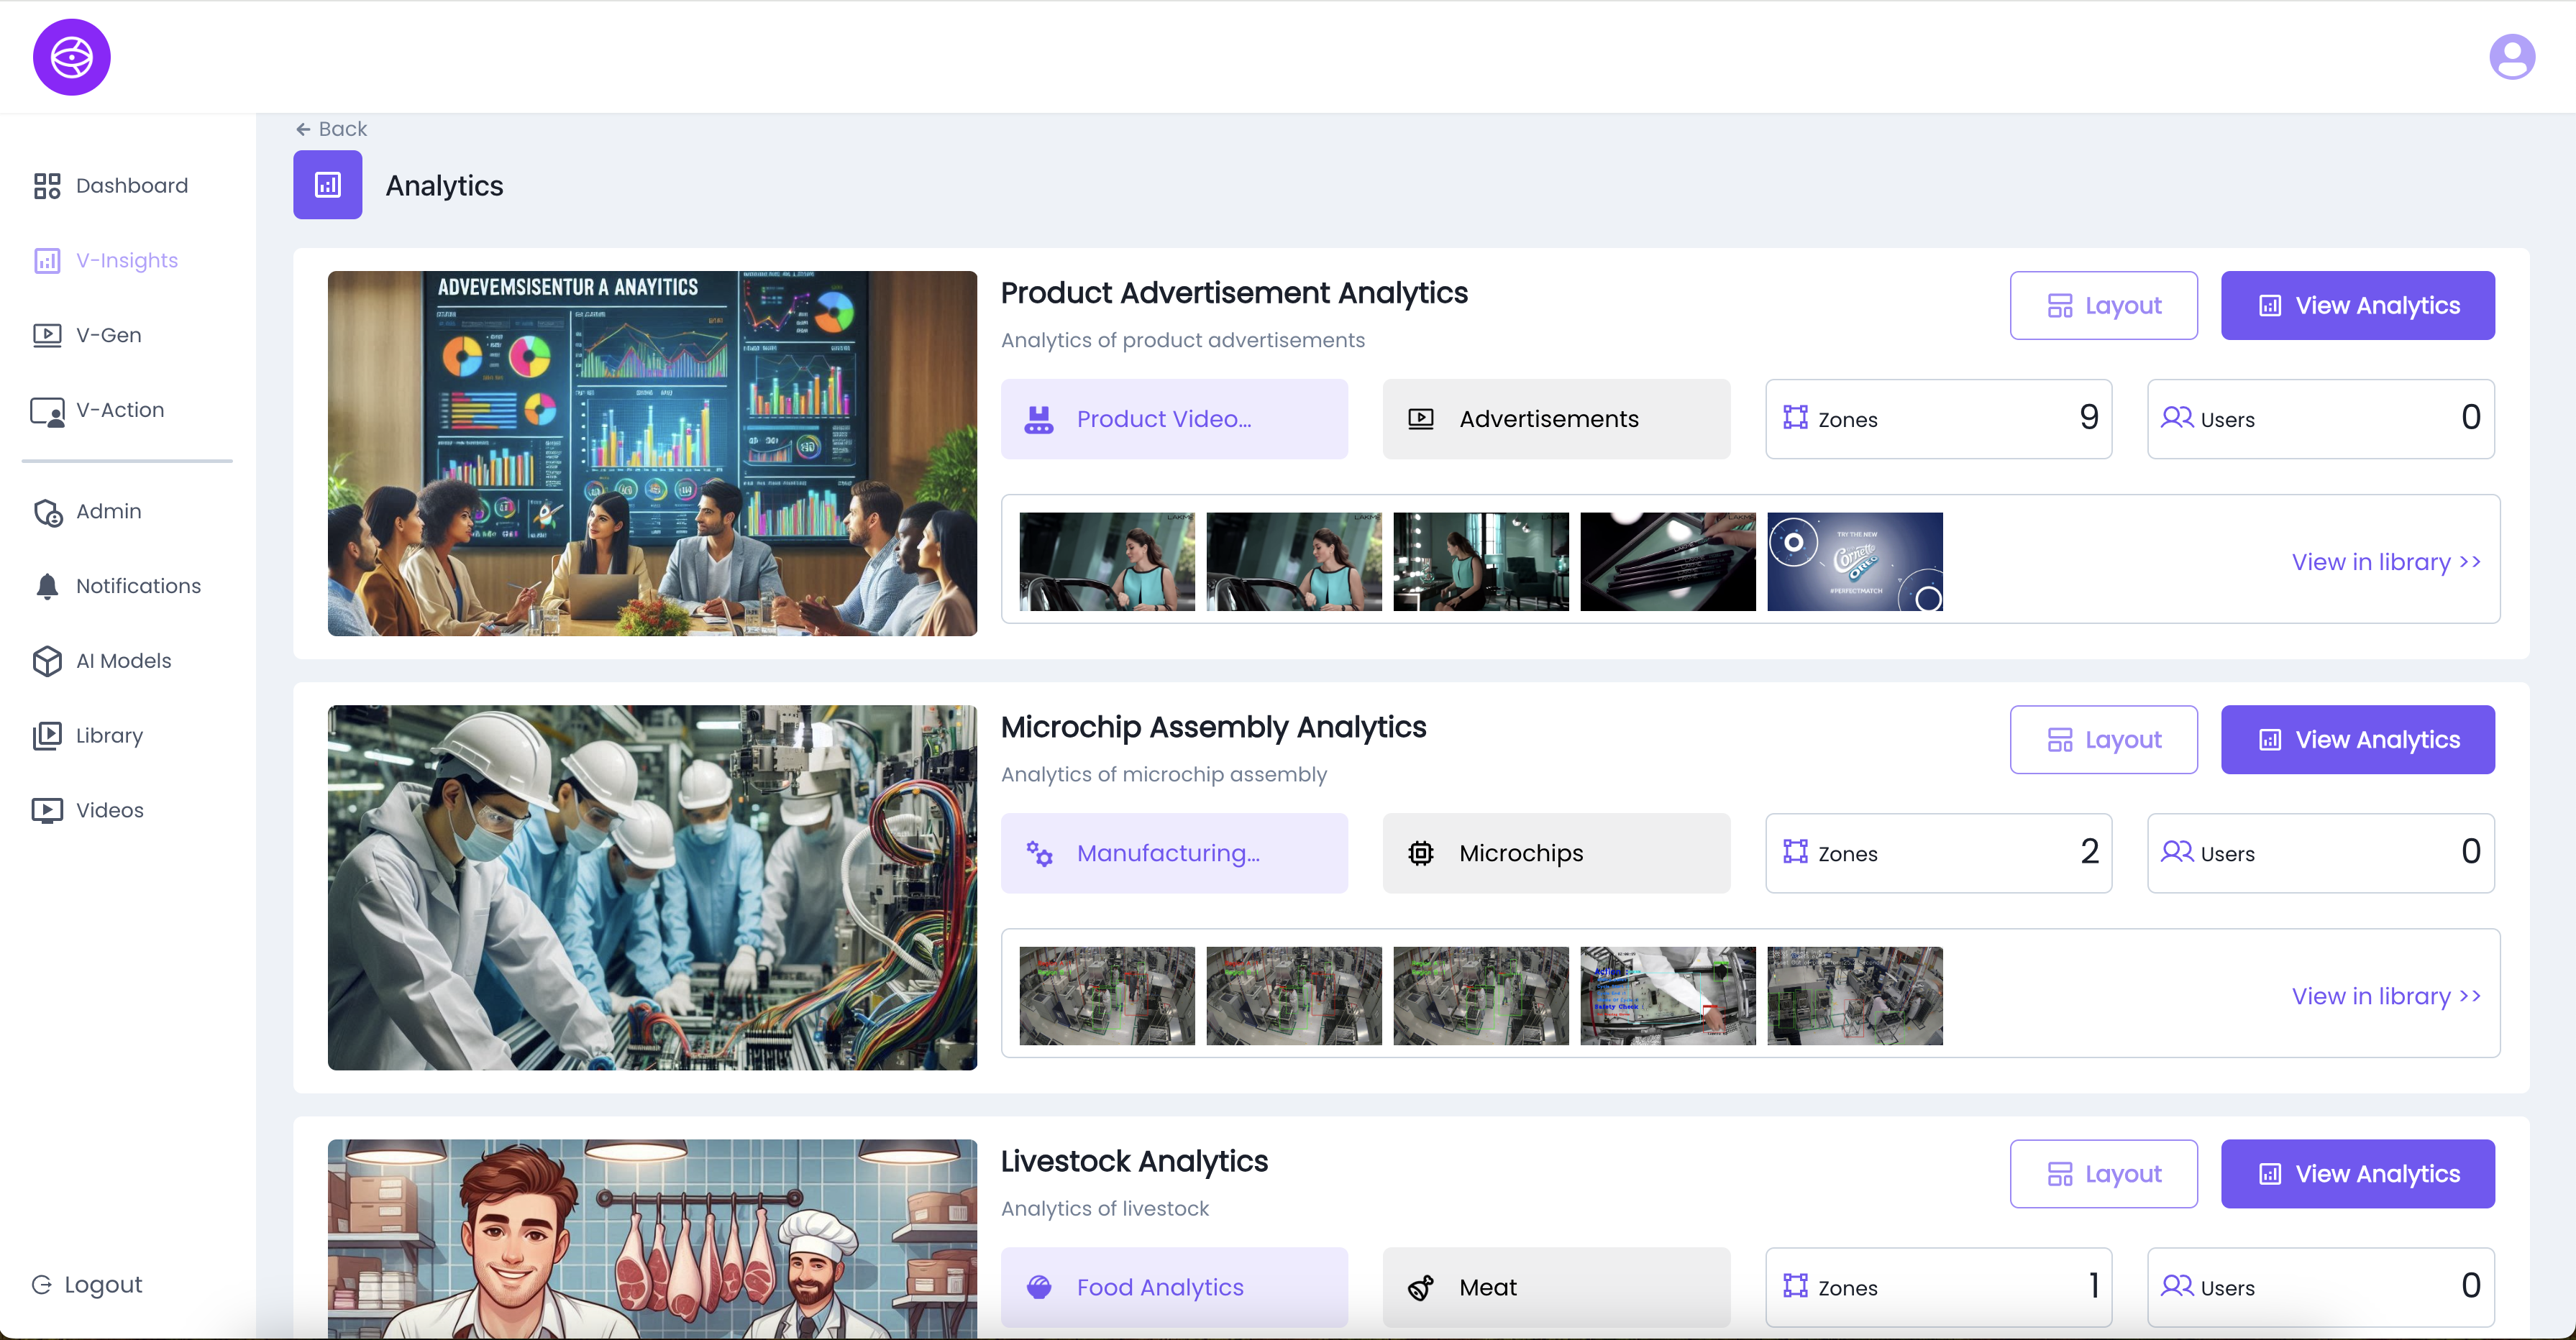
Key Features on the Analytics Page:
- Analytics Cards
- Each card represents a specific analytic project.
- Example analytics:
- Product Advertisement Analytics
- Microchip Assembly Analytics
- Livestock Analytics
- Analytics Details
- Title & Description → Brief explanation of what the analytic does.
- Categories/Tags → e.g., Advertisements, Manufacturing, Food Analytics.
- Thumbnail Previews → Snapshots of input sources or frames linked to the analytic.
- Zones
- Displays the number of zones configured for each analytic.
- Example: Product Advertisement Analytics → 9 Zones.
- Users
- Shows how many users have access to each analytic.
- Helps in managing user-level permissions.
- Actions Available
- Layout → Configure or modify how zones and sources are structured.
- View Analytics → Open the analytic to review results, metrics, and dashboards.
- View in Library → Direct link to related media stored in the library.
Layout Design – Product Advertisements Analytics
The Layout Design panel allows users to visualize and analyze their operational zones effectively through an interactive layout. This tool is especially useful for mapping product advertisement zones and optimizing spatial analytics.
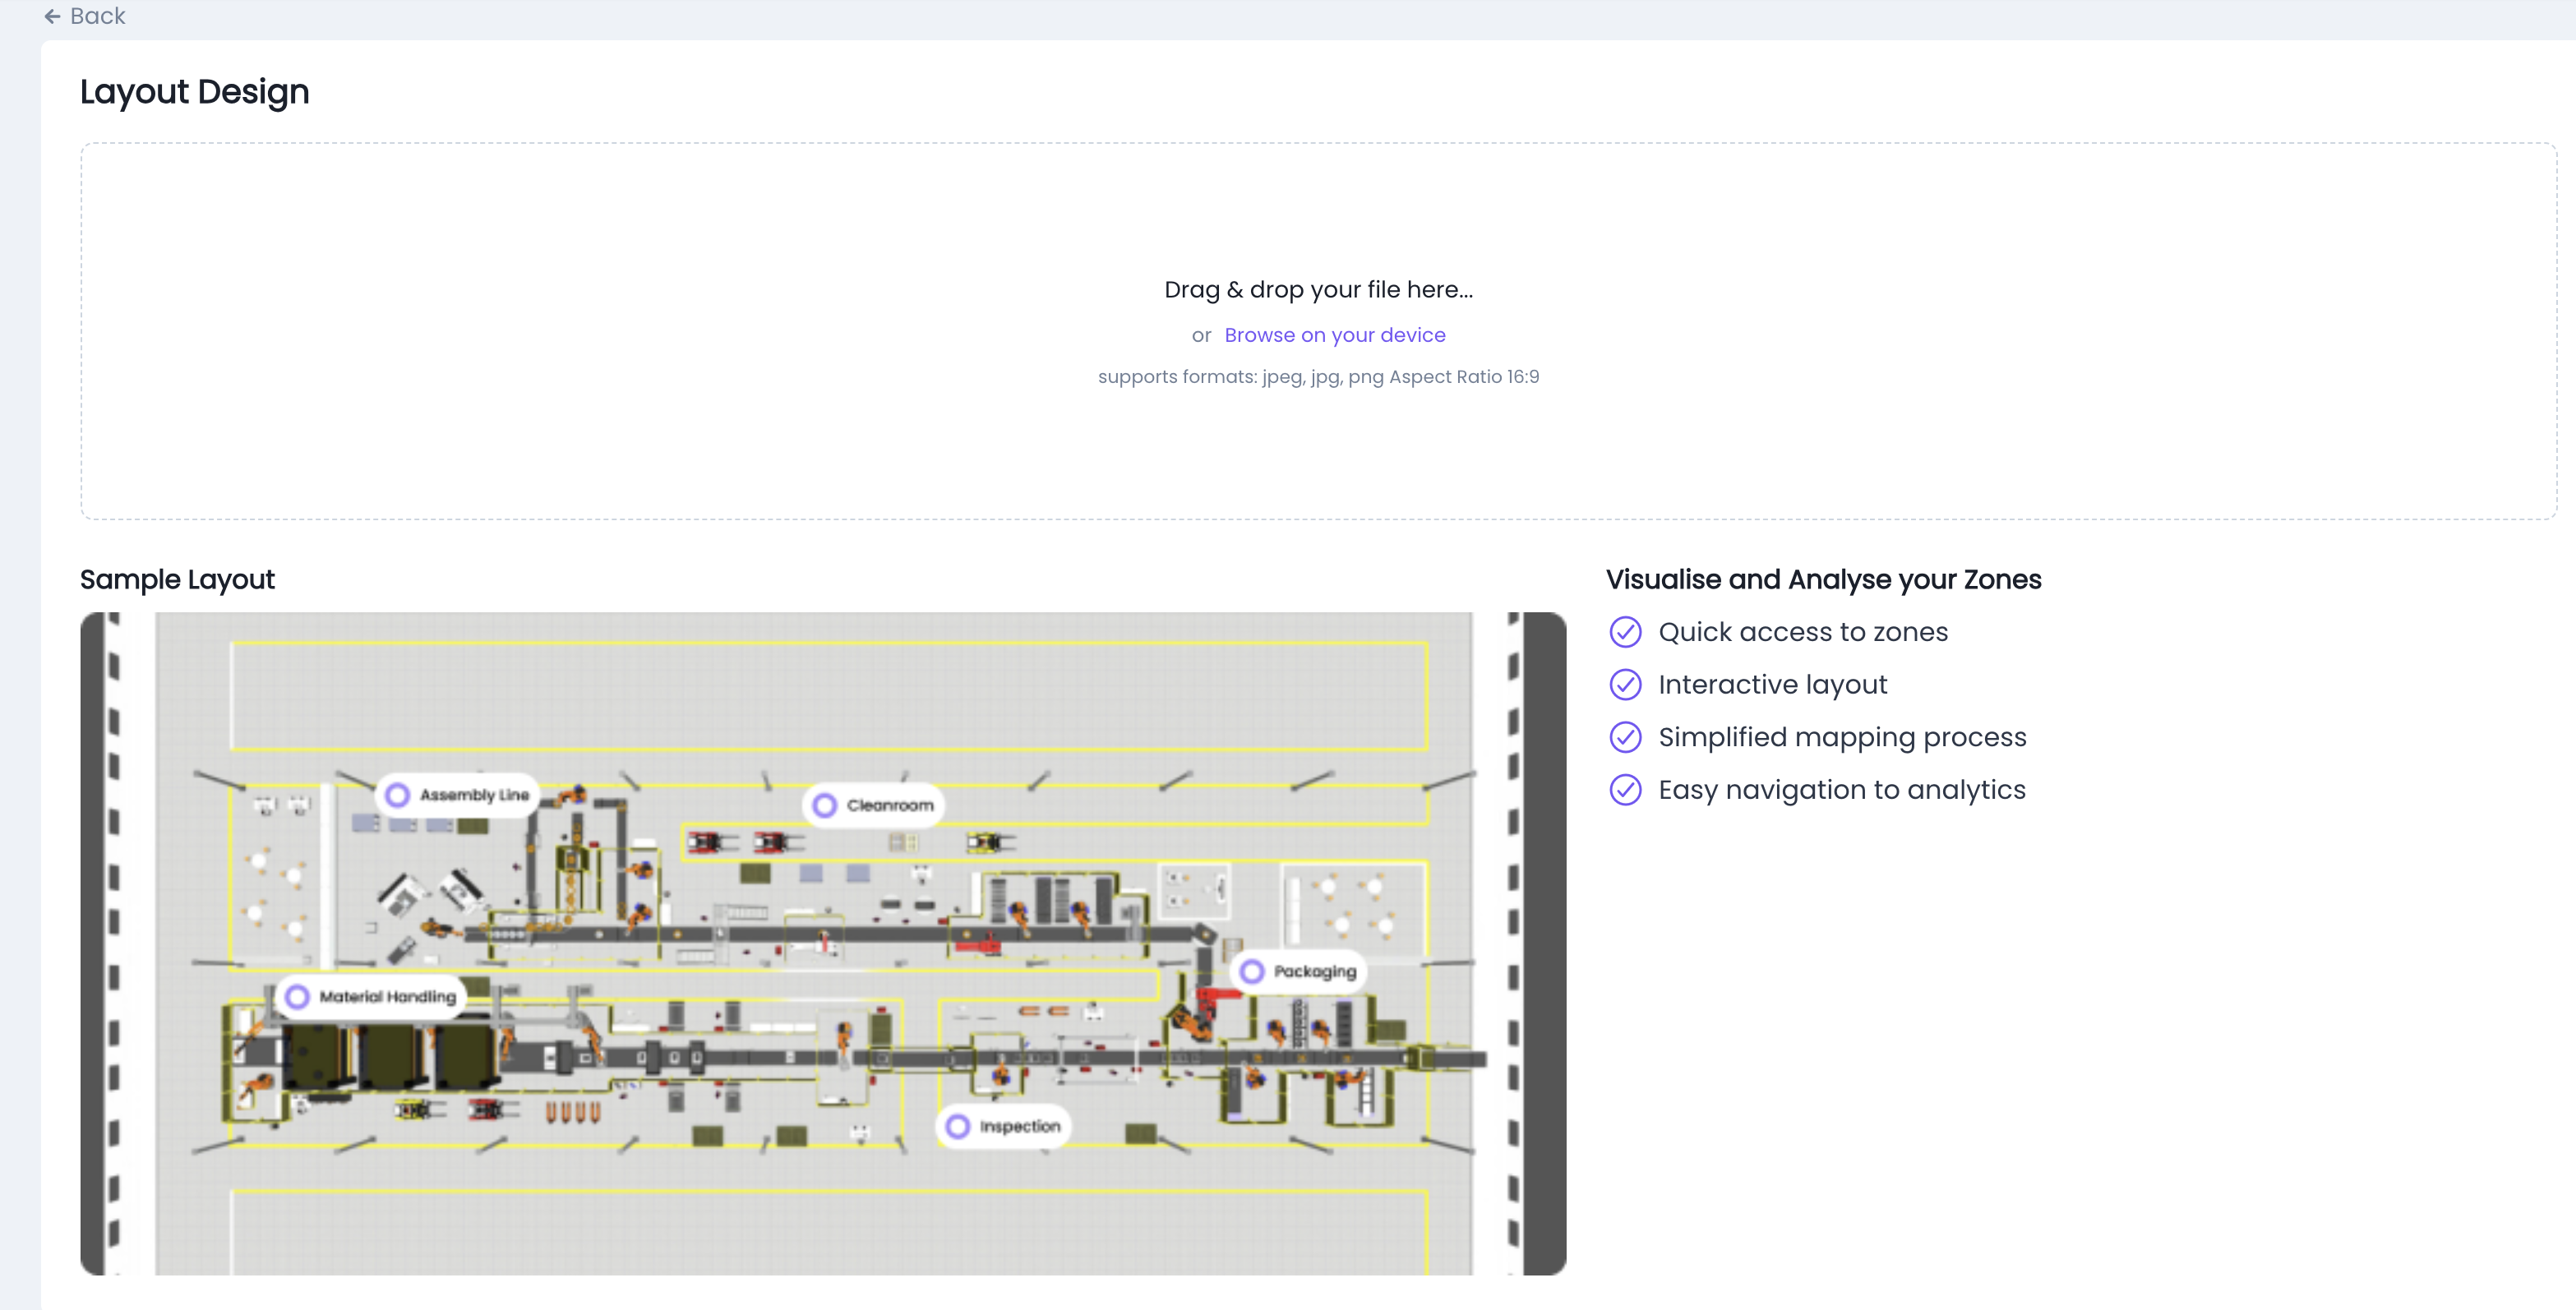
Features:
- Drag & Drop File Upload
- Upload your custom layout design directly.
- Supported formats: .jpeg, .jpg, .png
- Recommended Aspect Ratio: 16:9
- Sample Layout Overview
- Includes common zones such as:
- Material Handling
- Assembly Line
- Operations
- Packaging
- Inspection
- Visual reference helps with:
- Planning advertisement spots
- Zone-based performance tracking
- Traffic and attention heatmap overlays (if supported)
- Includes common zones such as:
- Visualise and Analyse Your Zones
- Quick Access to Zones: Instantly navigate to any operational area.
- Interactive Layout: Clickable layout for detailed zone insights.
- Simplified Mapping Process: Easily align analytics with physical spaces.
- Easy Navigation to Analytics: Connect spatial zones to real-time performance dashboards.
How to View Analytics in V-Insights
Follow these steps to open and review an analytic:
Step 1: Navigate to V-Insights
- From the sidebar menu, click on V-Insights.
- The Analytics overview page will appear, showing all available analytics.
Step 2: Select an Analytic
- Identify the analytic you want to review (e.g., Product Advertisement Analytics).
- Each analytic card shows its title, description, zones, and users.
Step 3: Click “View Analytics”
- On the chosen analytic card, click the View Analytics button.
- This opens the detailed analytics view for that project.
Step 4: Review Data and Metrics
Inside the analytic view you can:
- View Graphs & Charts → Generated from processed data.
- Filter by Timeframe → Live data (last 6/12 hours) or complete datasets for offline videos.
- Inspect Zones → See results specific to each configured zone.
- Check Detected Objects/Classes → Review what models have identified (e.g., products, microchips, livestock).
Step 5: User Access Control
- Only users mapped to the analytic will be able to view its details.
- Tenant Admins can update access permissions if needed.
Example Analytics View – Product Advertisement Analytics
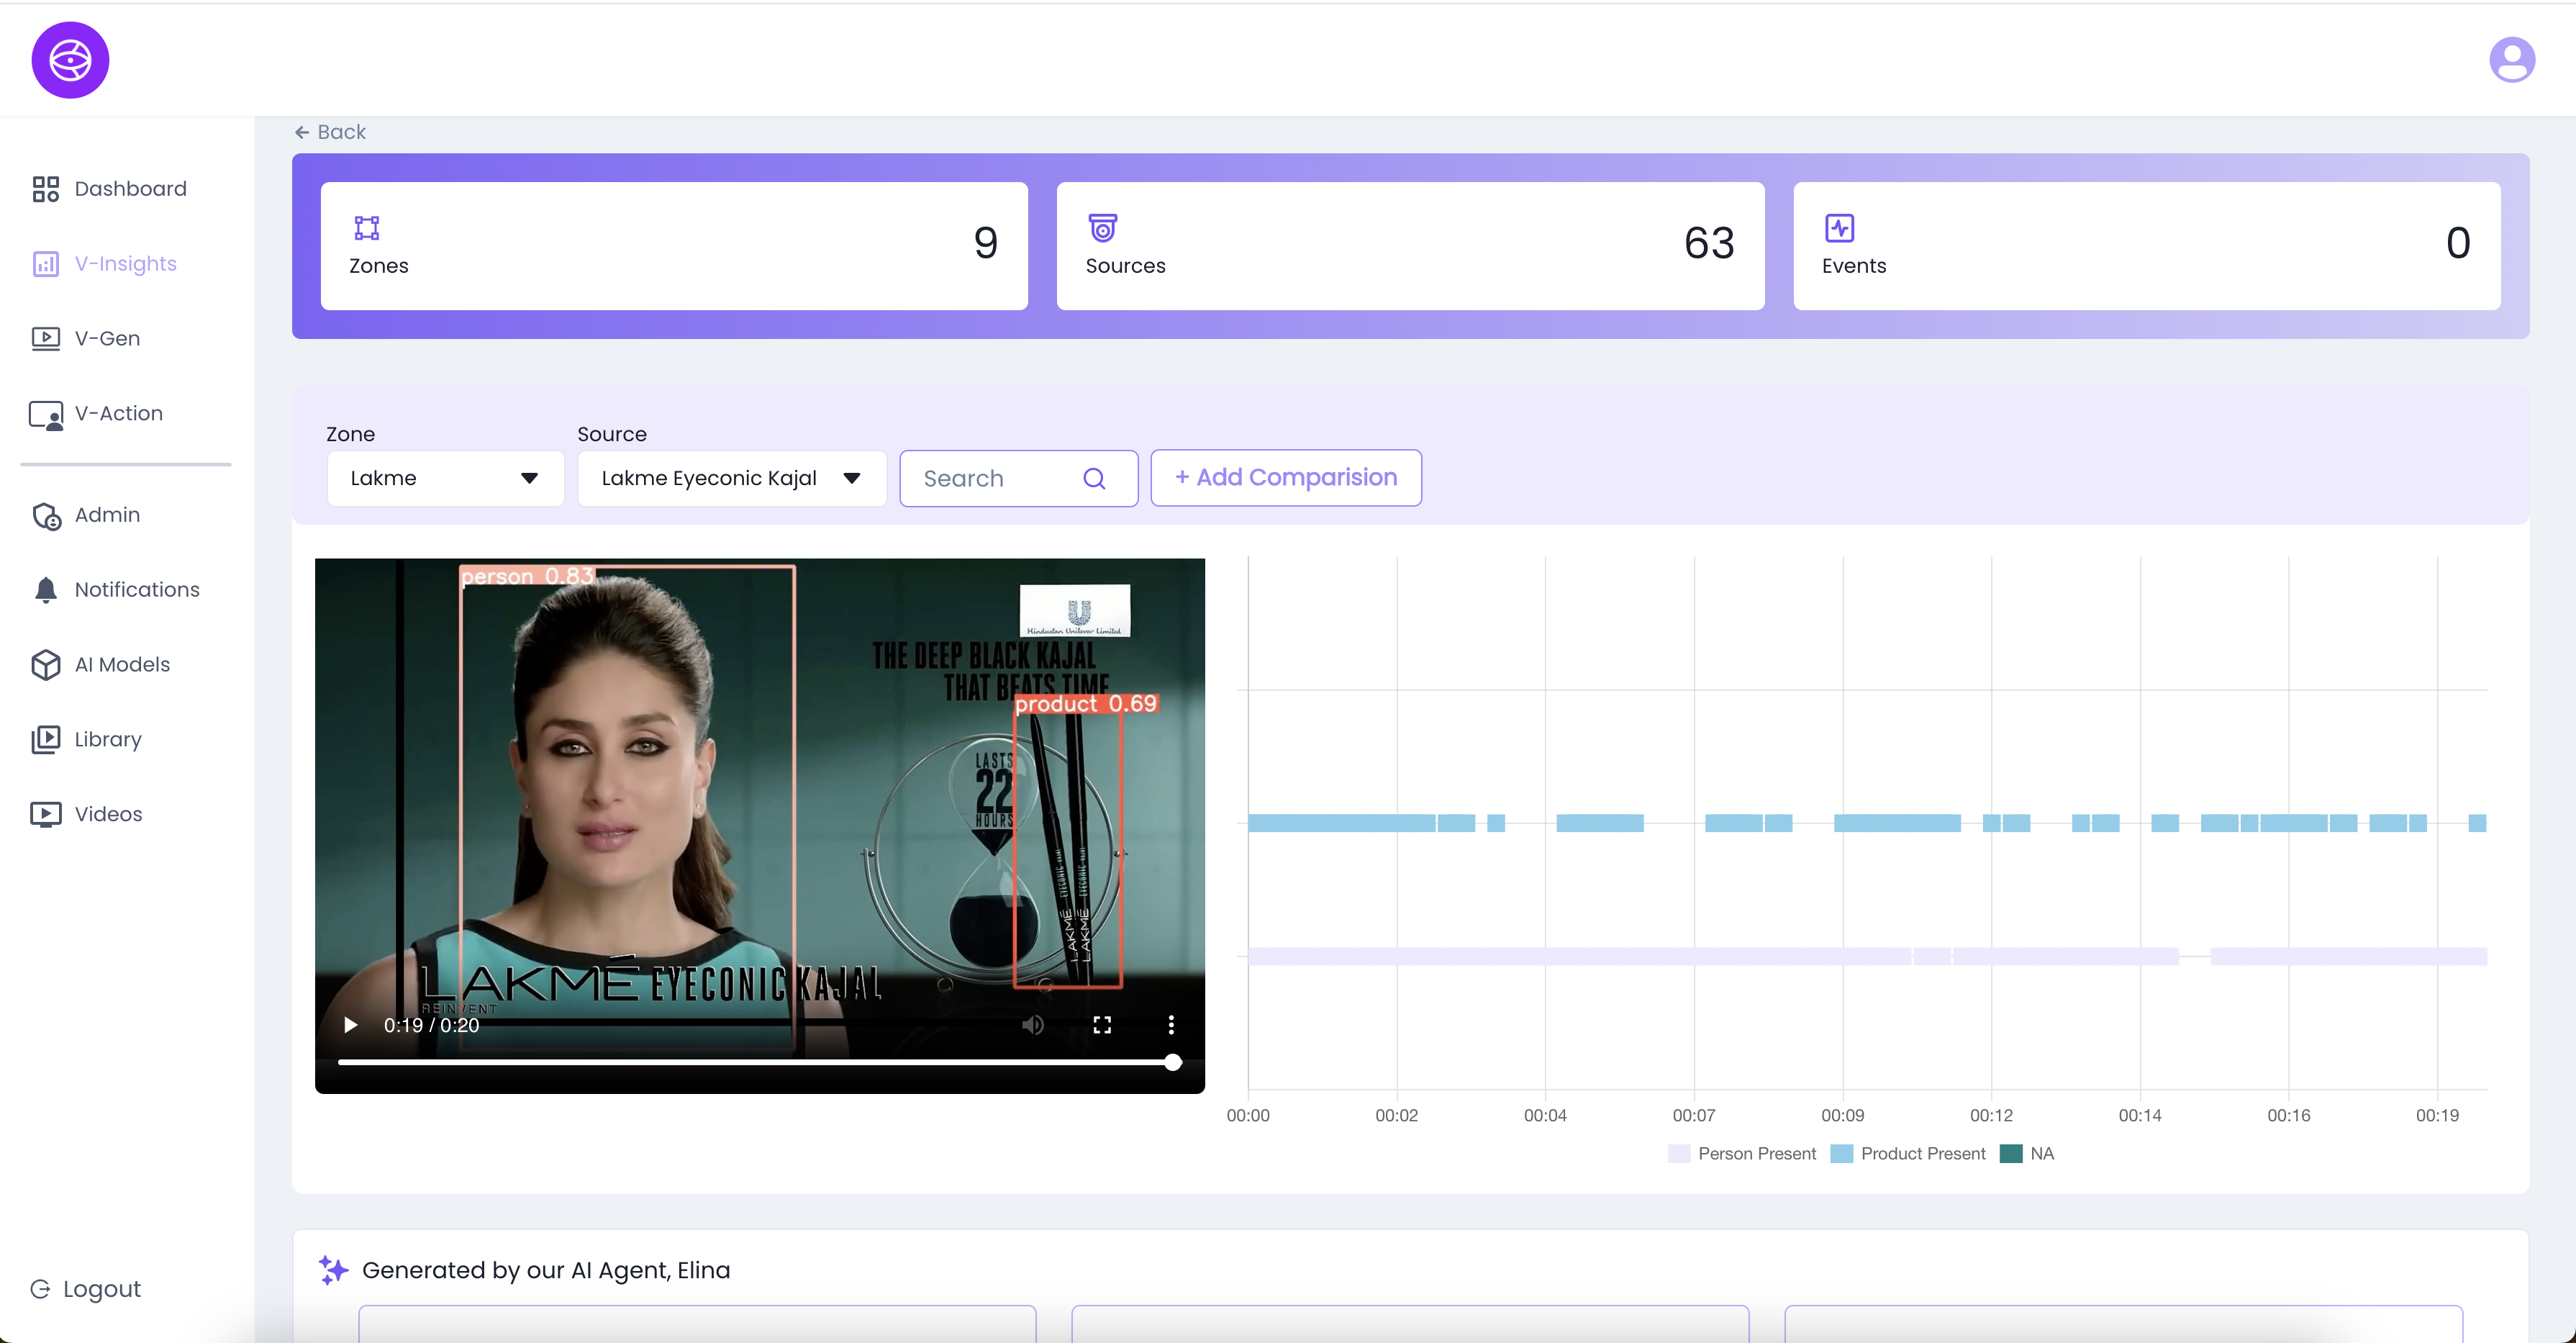
Search & Visual Analytics in Video
The Search and Graph Analytics panel provides powerful tools to identify product appearances, track people, and analyze content presence in advertisement videos.
Interface Overview:
- Zone Selector: Choose the display zone where the ad is showcased (e.g., Lakme).
- Source Selector: Select the advertisement or video source (e.g., Lakme Eyeconic Kajal).
- Search Bar: Type keywords (e.g., eye, car, mirror, etc.) to detect relevant frames where the object or keyword is likely associated.
- Add Comparison: Use this to compare analytics between different products, timeframes, or zones.
Graph Explanation:
- The graph is a time-based timeline view of the video (in seconds).
- Each row represents a type of detection:
- Light Blue Bars: Product presence (e.g., Eyeconic Kajal)
- Grey Bars: Person presence
- Dark Green Bars: NA or not applicable (no detection)
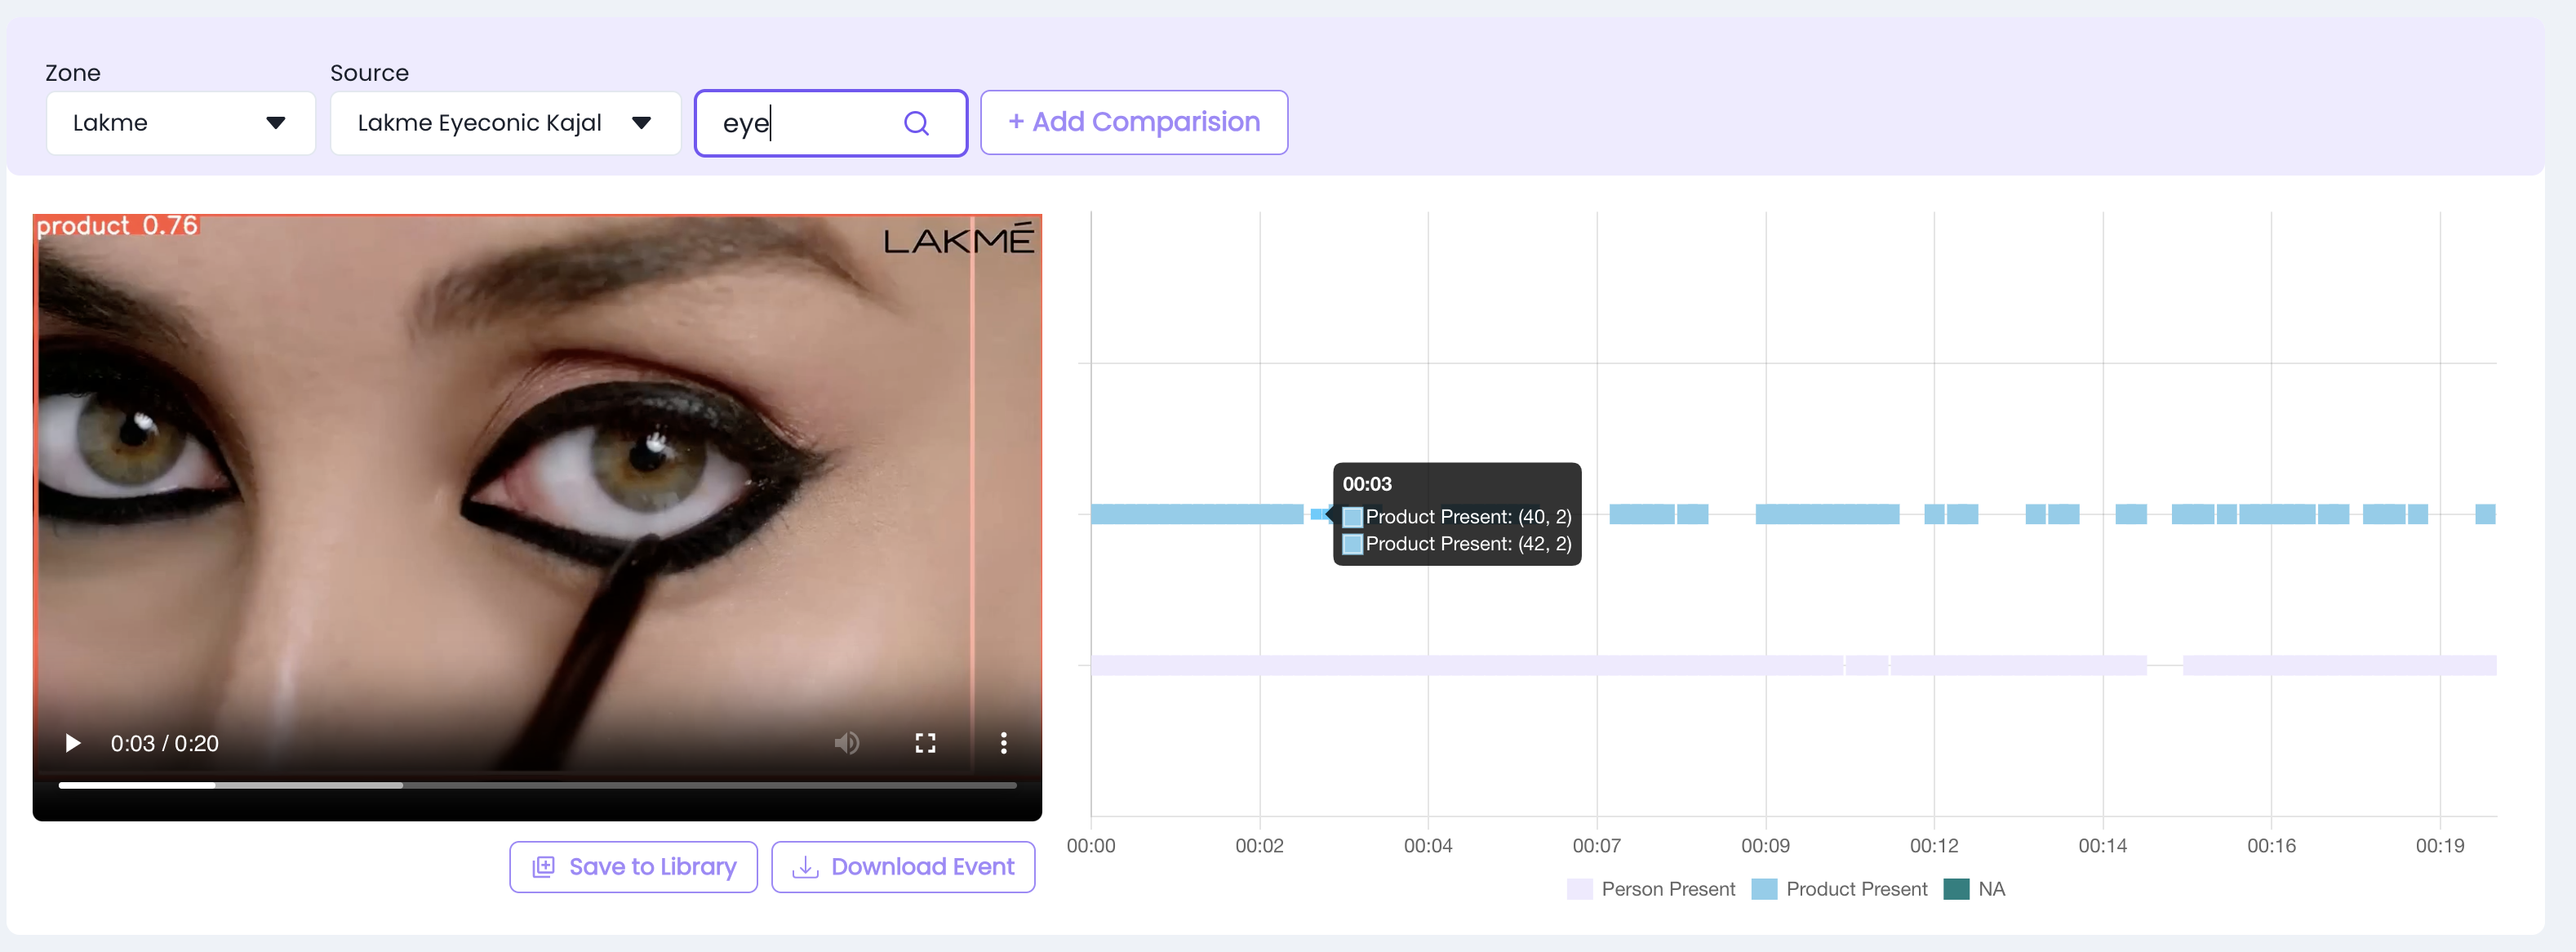
Example Insight from Image:
- At 00:03, the product was detected with confidence scores (40, 2) and (42, 2).
- This indicates multiple frames containing the product around the third second.
- The video snapshot shows close-up application of eye kajal, matching the search keyword eye.
Available Actions:
- Save to Library: Stores the current analysis snapshot for future reference.
- Download Event: Exports the timeline and detection metadata.
AI Chat Assistant with Video Analytics Panel
The AI Chat Integration with video analytics enhances user interaction by offering real-time support, contextual information, and automated insights related to advertising performance.
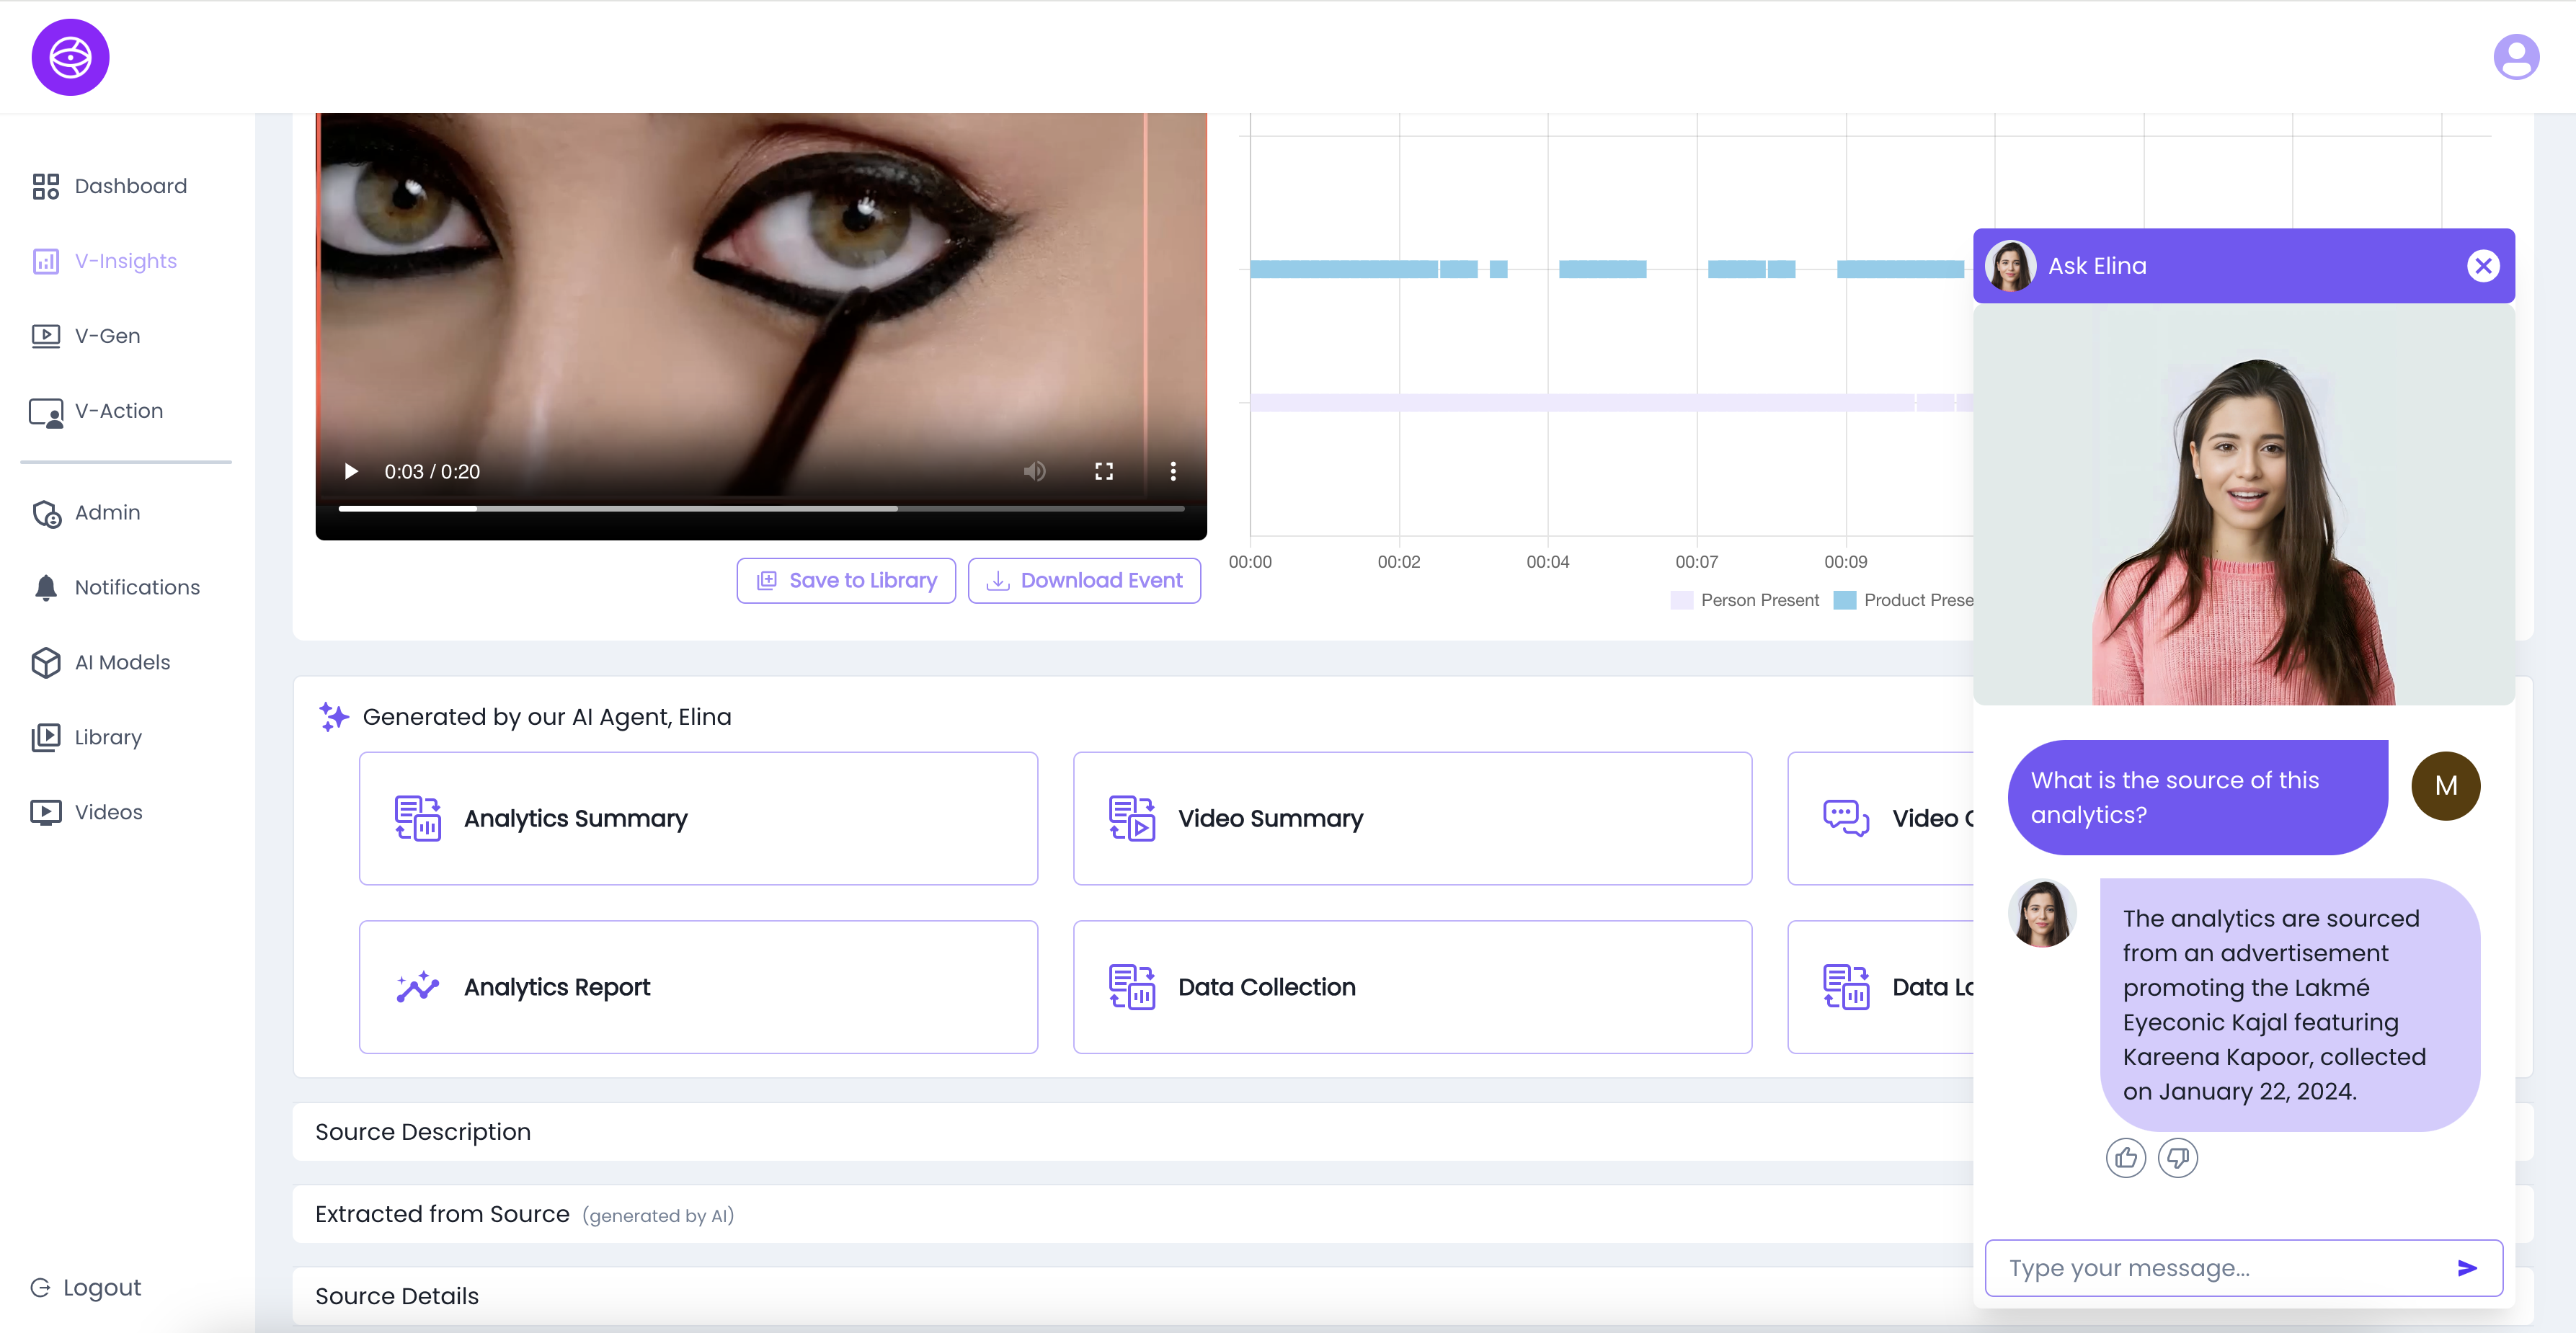
AI Assistant – Elina
- Embedded chatbot for answering user queries instantly.
- Offers contextual understanding of analytics, sources, and summaries.
- Responds to queries such as:
- “What is the source of this analytics?”
- “When was the video collected?”
- “Who appears in the video?”
When Does the Video Chat Open?
- Auto-Open Behavior
- The chat assistant panel automatically opens as soon as the user enters the View Analytics panel.
- This ensures instant access to AI-powered insights, source data, and real-time assistance without requiring user interaction.
- Manual Trigger Option
- Users can manually reopen or toggle the video chat panel at any time by clicking on the “Video Chat” button/icon available in the analytics interface.
- This is useful if the chat was closed earlier or if further queries arise during exploration.
AI-Generated Analytics Section
Under "Generated by AI Agent, Elina", the following modules are available:
- Analytics Summary – Key highlights and product exposure stats.
- Video Summary – AI-generated textual overview of the ad content.
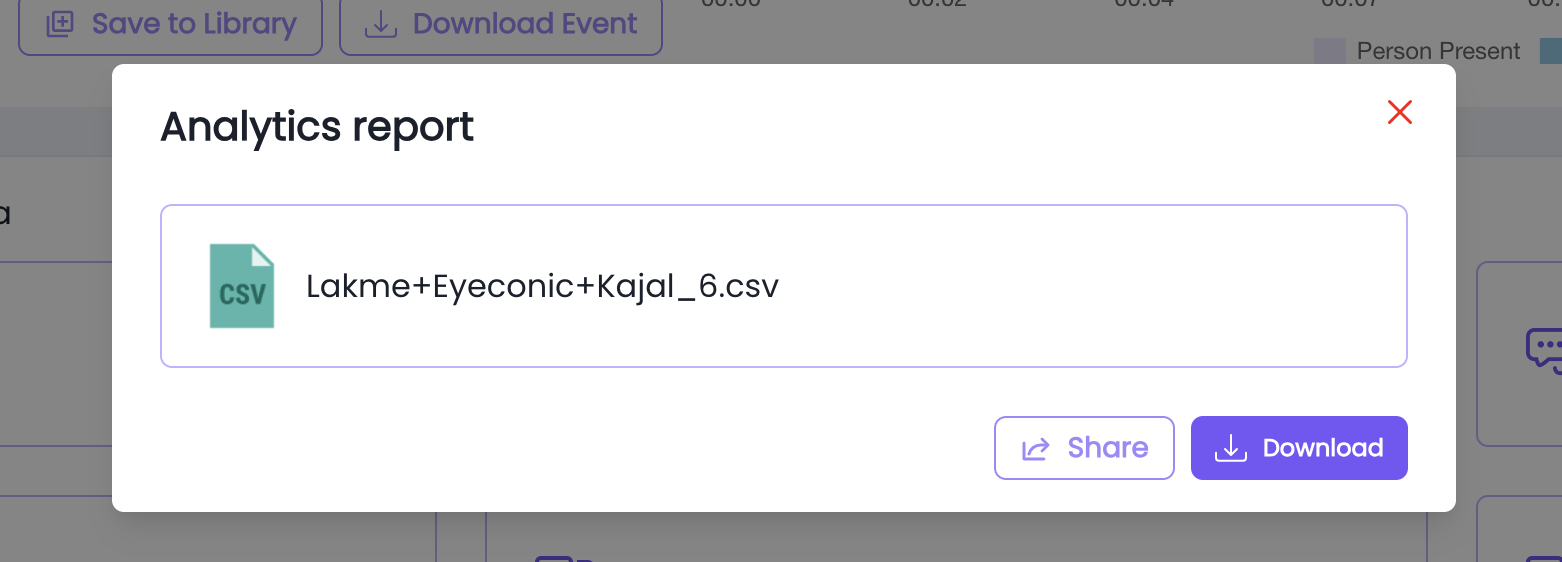
- Analytics Report – In-depth breakdown of product/person presence, frequency, and timestamps.
The Analytics Report provides a downloadable .csv file containing detailed product and person detection data from the video.
Key Features:
- File Format: CSV (e.g., Lakme+Eyeconic+Kajal_6.csv)
- Includes: Timestamp, product name, person presence, and confidence score
- Actions:
- Download – Save the report locally
- Share – Generate a shareable link
- Data Collection – Source-level data acquisition details.
- Data Labelling – Elina integrates with Label Studio, an open-source data labeling tool, to enable manual annotation and training data refinement.
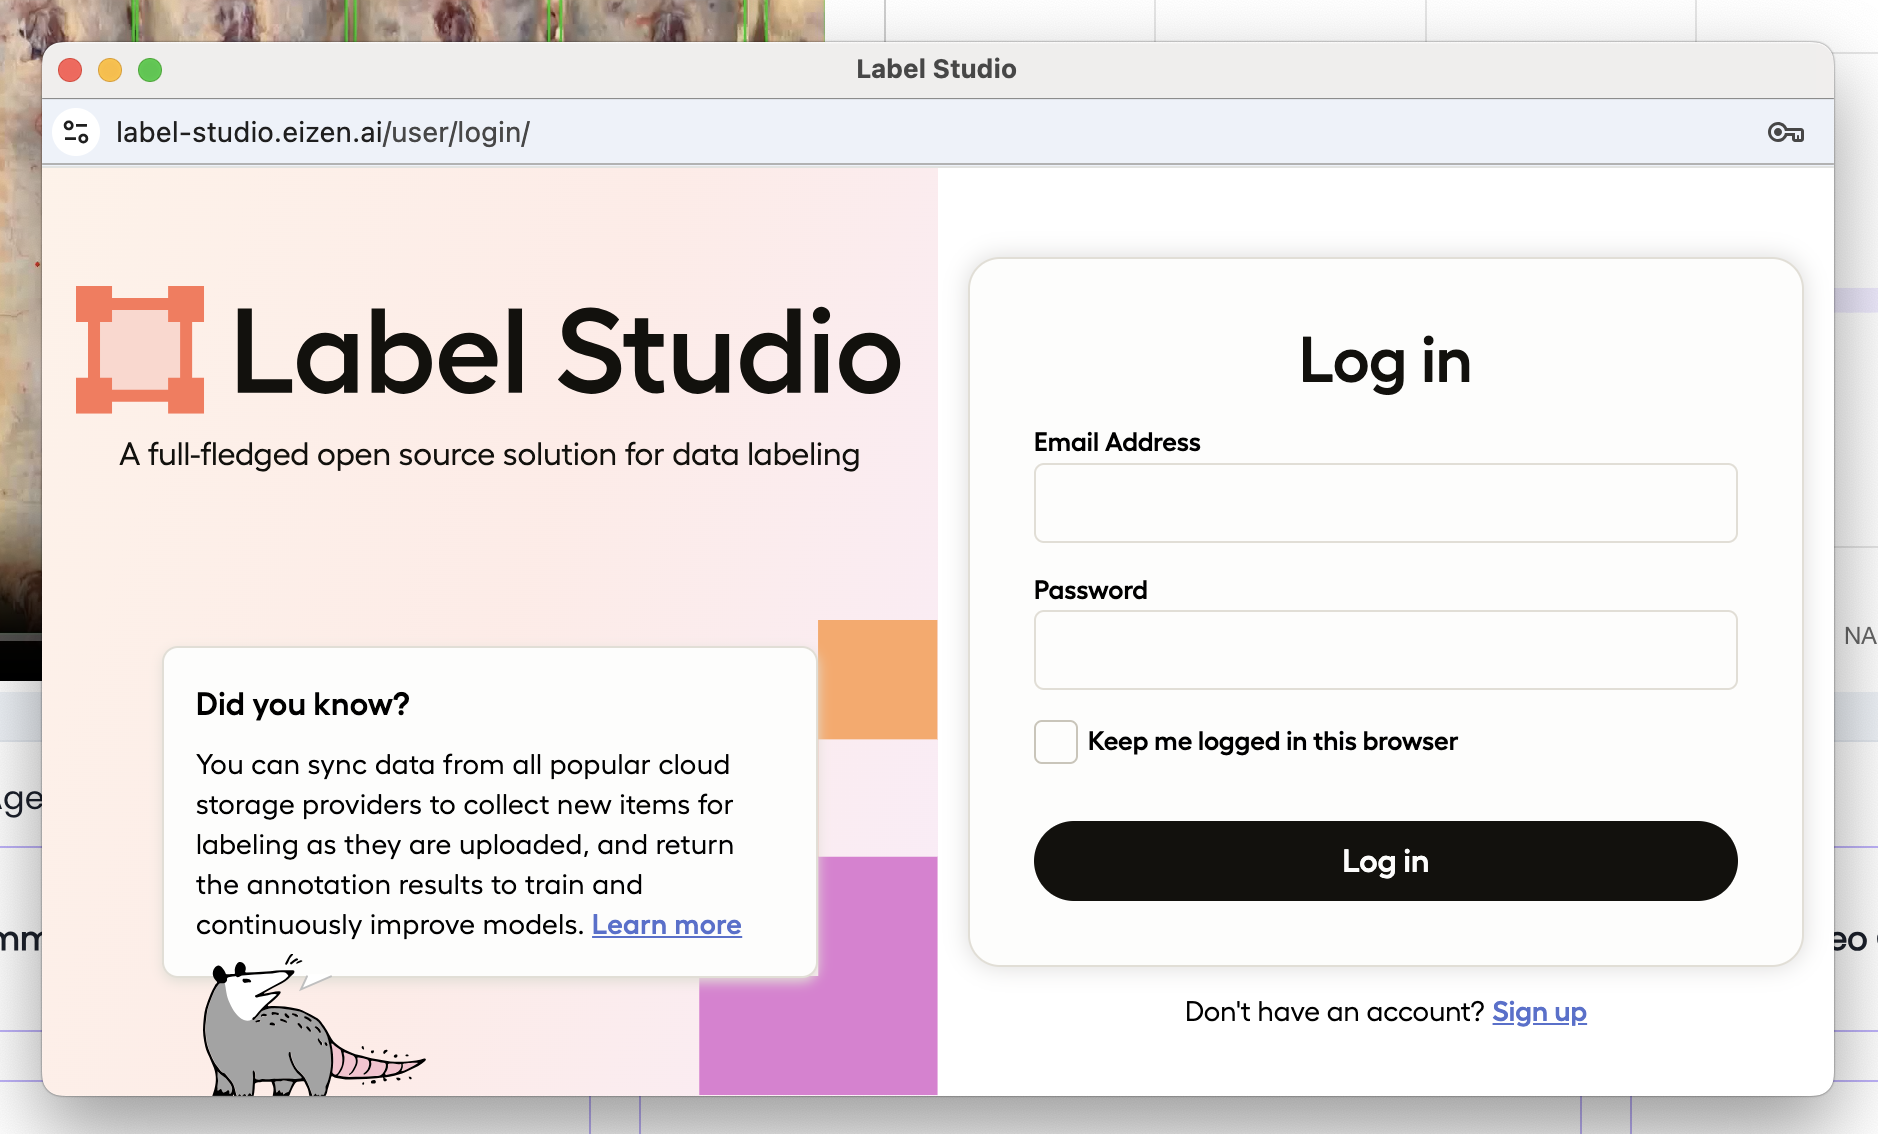
Accessing the Labeling Tool
- Navigate to Data Labeling from Elina’s interface.
- You will be redirected to Label Studio (label-studio.eizen.ai).
- Log in with your credentials to access labeling tasks.
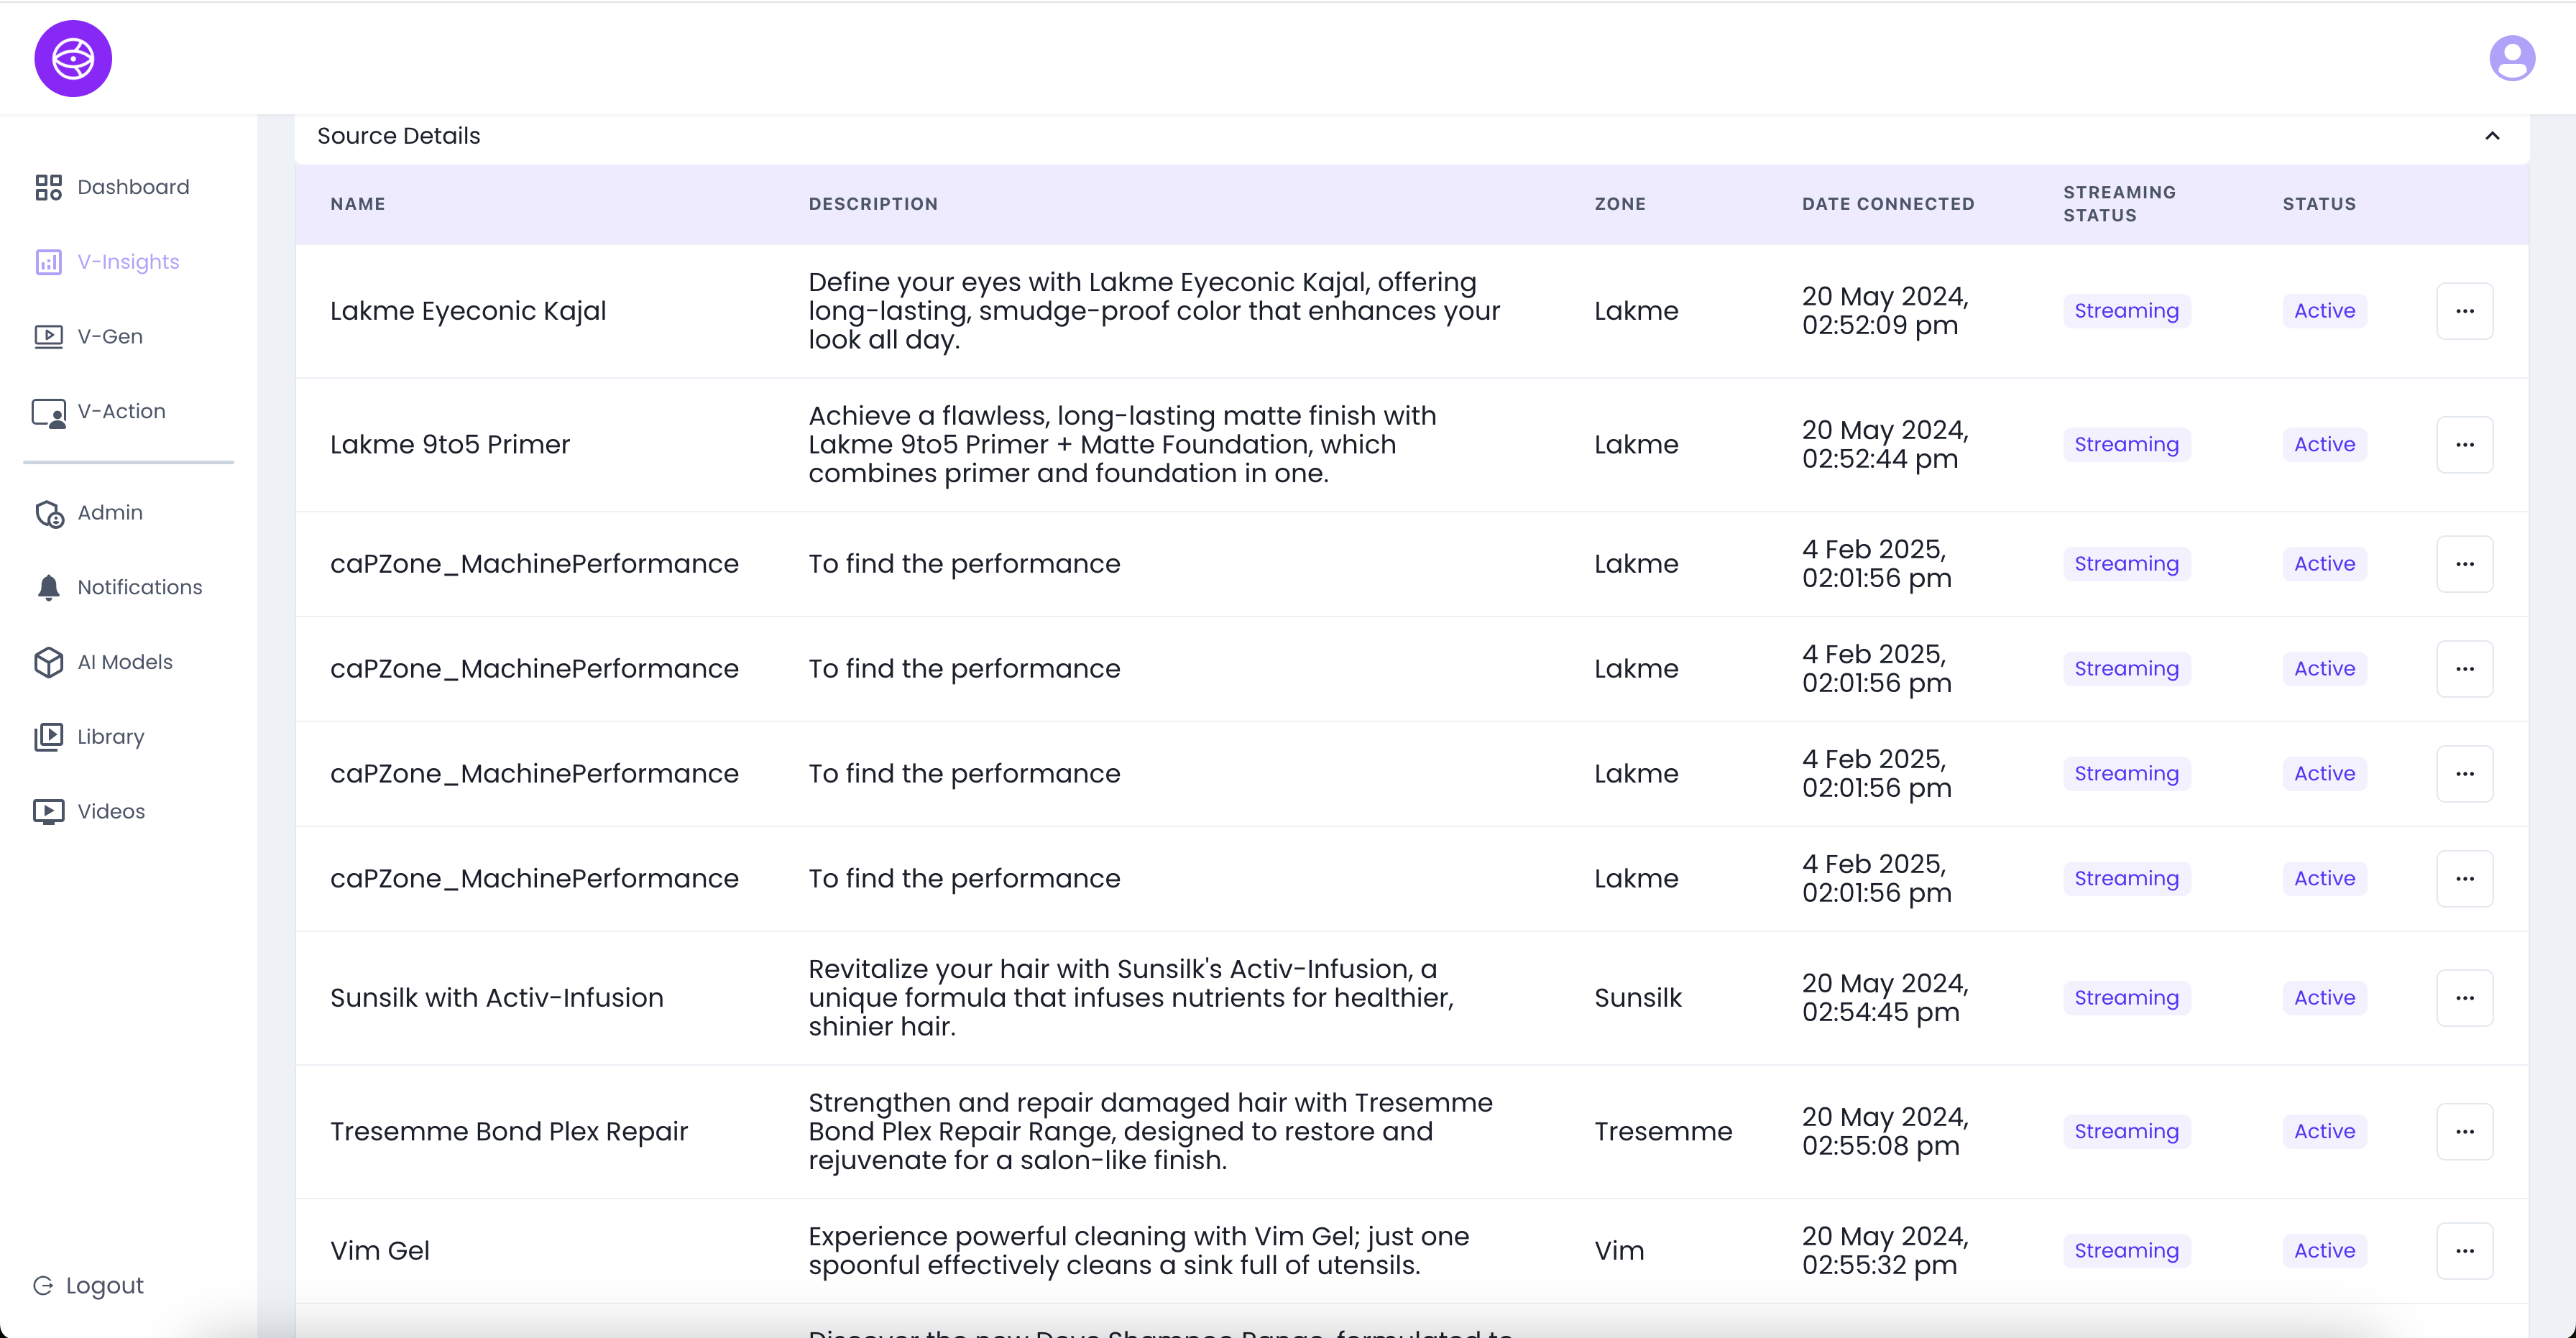
Additional Source Info
- Source Description: Manual or auto-extracted summary of the ad.
- Extracted from Source: AI-generated information directly pulled from the media.
- Source Details: Technical metadata (e.g., ad duration, capture date, product tags).
Recent Videos
The Recent Videos section, powered by AI agent Elina, provides a quick overview of analyzed videos along with detected objects or themes.
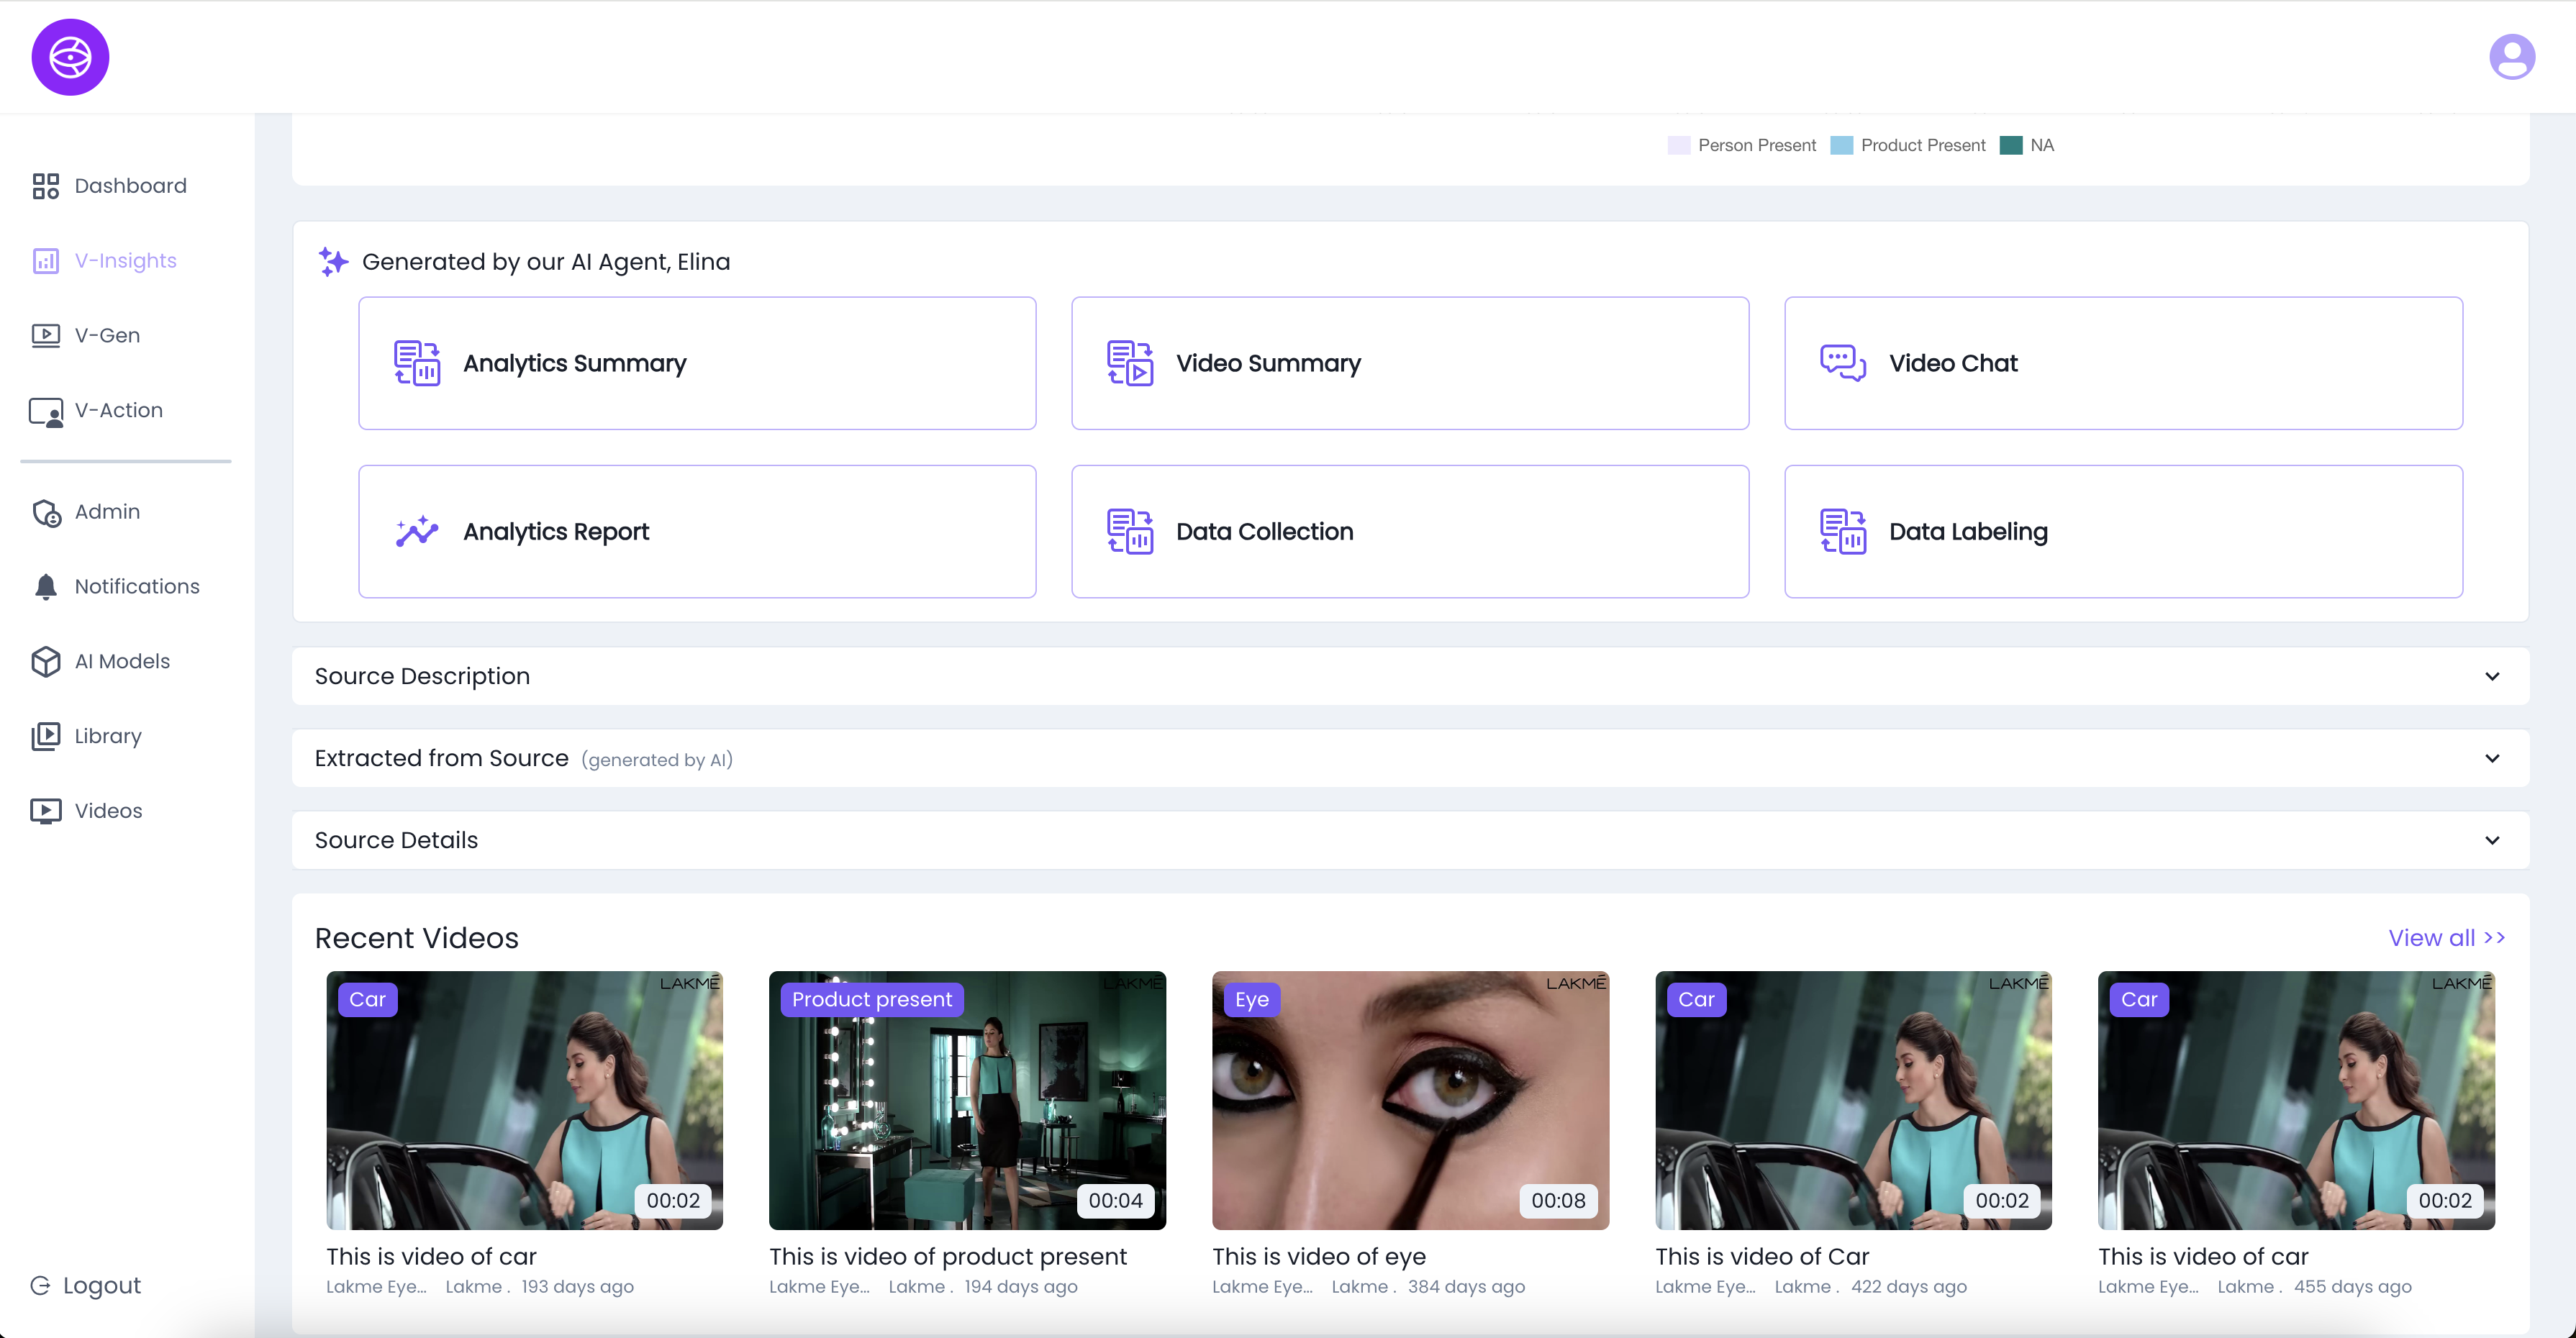
Key Elements:
- Recent Videos: Displays the latest processed content with:
- Tags (e.g., Car, Product Present, Eye)
- Video duration
- Timestamp (e.g., “193 days ago”)
- Auto-Generated Titles: Simple and descriptive titles like
"This is video of product present"